Archive for the ‘Miscellaneous’ Category

uBlock Origin Chrome Extension Debugging on Windows

October 2, 2020

This article will explain how uBlock Origin extension perform the script injection process after the page already loaded. This scripts called scriptlets is used to perform various blocking type for inline scripts within the web document.

When the browser is in the process of finishing the loading of page, it will intercepted by uBlock Origin using the browser.webNavigation.onCommitted listener function:

This is declared in [extension root]/js/vapi-background.js

It then calls the onNavigation declared in [extension root]/js/tab.js as follows:

The injectNow will be called based on the above condition which is located in µb.scriptletFilteringEngine.injectNow:

The above routine is located in [extension root]/js/scriptlet-filtering.js. It will perform checks whether the protocol is http, https, or ws and if not satisfying this condition, it just return.

Then it will perform whether there’s a scriptlet rule for this host:

As you can see, if there is none, the function just return. The retrieve method is declared in [extension root]/js/scriptlet-filtering.js:

After it is passing various checks it will perform scriptletDB.retrieve:

The retrieved scriptlet is stored in $scriptlets:

In this case it is the window.open-defuser scriptlet. This name is corresponding to the javascript file name declared in web_accessible_resources extension folder. There’s also a mapping data to provide the mapping between the scriptlet name, and in this example it is the mapping between nowoif to window.open-defuser:

It is declared in [extension root]\js\redirect-engine.js. Let’s deep dive into scriptletDB.retrieve method which is declared in [extension root]\js\static-ext-filtering.js:

As you can see from the above function routine, it first perform retrieval based on hostnameToSlotIdMap. Based on Slot ID, it will get the strId from hostnameSlots that contains array of slot id based on slot retrieved from previous map data.

For example, let’s use some sample data from hostnameToSlotIdMap:

Let’s use the element #1 which maps the “youtube.com” to the slot id 2. This will give this.hostnameSlots[2] = 2 for strId. The retrieved strSlots will be 1 (which is 2 >>> 1) = 1. Then the strSlots[1] is:

So, the scriptlet will be json-prune with some other parameters. This concludes the discussion on how uBlock perform script injection and execution.

Analyzing Paid4link Website

September 28, 2020

This site can use many domain names, such as this one called http://womenhaircolors.review/. It do not have the SSL secure connection or https. And when it is navigated without any parameter it will show:

This domain is owned by Paid4link!
for any abuses please contact us at cs@paid4link.com

When it is provided with incorrect parameter it just show that the page is not exist. But when the parameter is correct, it will show some enticing information such as APK download:

But it is misleading because as soon as you click anywhere on the page, it will directly navigates to one of the link provided in the page for example which is:

In this case it will navigate to several link randomly within the same domain name which is chordlyricslagu.blogspot.com. The link will be diferrent depending some unknown factor.

Since it is an inline script, currently AdBlock Plus extension can not block this type of script. You can use the other extension such as Total Script Blocker:

But it will block all script execution by performing functional substitution. So when the user try to clicks on the page, it will not navigate to the advertisement url. If you perform detailed checking, actually there’s an error there that’s related to Math.random function:

As you can see, it also affected other script as well. In this case, what I want to block is the function called “tampilkanUrl” to be substituted with some empty execution block so that the click do not have the effect or by some advanced pattern matching so that this type of script can be substituted with empty function.

A better approach is using the uBlock Origin extension:

In this extension, after the page is loaded, when I click anywhere on the page, now it do not navigates to the advertisement website, and there’s no error in the log console.

This is because there’s an uBlock rule called nowoif or window.open-defuser in the website:

This will hook the window.open function and will return null if some condition is fulfilled:

A more granular approach will be by adding the script block that call the removeEventListener for the specific event, in this example is the click event and specific function, and in this case “tampilkanUrl” like so:

This can be converted into some rule and enhanced into uBlock Origin or other ad blocker extensions, so that it provides a specific script level blocking to the website.

How AdFly Detect AdBlock Plus Extension

September 24, 2020

When the ad blocker extension (such as AdBlock Plus) is active in the chrome browser, the AdFly advertisement website will show the message block as follows:

In view111.js the function in picture below will set the above div element to be shown:

Here is the obfuscated variables revealed in the debugger screen:

So, the div element with id “_bd” is set into show and this div element is the adblock notification box above. Here is the call stack that leads to the above condition:

Inside the V6f function as follows:

Here is the obfuscated variable list:

As you can see, both checks for c91[3] and c91[4] is false, leaving only the last condition that evaluates to true. So, it checks for the presence of element with adb id.

This info can be use the AdBlock extension to counter the checking process so that the AdFly can continue execution without the unwanted scripts being executed.

But anyhow, even when this warning is in effect, you can still grab the encoded string and perform link decode as described in previous article.

Analyzing AdFly Website

September 23, 2020

The skip ad link access is declared in ysmm variable:

It will be placed in the link ref of an anchor element:

Using break on element changes in chrome for the href modification, I have as follow:

The script view111.js is downloaded from remote source and format it for easy view and here is the location of href attribute modification:

The content of variable D9l[15] is the link when the skip ad is pressed, it contains a long base64 string as already shown above.

To process the above encoded string, there is an utility in python script called AdflyUrlGrabber in https://github.com/D4Vinci/AdflyUrlGrabber.

This python script will scan the presence of ysmm variable and processed the base 64 encoded string above, but in my machine it currently broken when it is try to decode the processed string:

So I can use other utility such as Winhex to convert the processed base64 encoded string with result as follows:

Which reveals the link behind skip ad button.

Then, it also create iframes such as sample below:

This causes the browser to follow the link above, in this example it is ainupheader.club when the “Skip Ad” is pressed instead of the intended link. The source of this link is calculated from amvn.js script. Disabling this script will prevent the unwanted link being visited.

Here is the precise link when you want to perform script blocking (for example AdBlock Plus):

||cdn.*/static/js/amvn.js

This is the iframe creation in amvn.js:

The “ba” variable will contain the ad website, which is ainupheader.club. Let’s explore how this string is generated which is calculated inside obfuscated function:

The parameter passed above, which is in base 64 encoding, when processed by this function will give the website name. This encoded long string is placed at the end of amvn.js script and it will be different each time the script is retrieved.

Here is processed data when it is supplied with different encoded string:

The generated names can be used by ad blocking extension to improve the web surfing experience in terms of bandwidth usage and other potential risks.

Potential Malware JavaScript Code Execution Walkthrough

September 17, 2020

The purpose of this article is to perform javascript code execution analysis of suspicious javascript script file to determine what is being retrieved and what local data is being accessed and what is being send.

The script in question is from https://urt7bpvfz4am.com/66/71/4e/66714e1c7ab01aa00453876e998fd9f5.js.

The above script may not exist anymore or may different by the time you perform access to the above link. The script is beautified, sanitized and deobfuscated using tool described in previous article.

When this script is loaded it will perform sendNetworkMetrics function as described in picture below:

Inside this function, it will perform checking of availability of perfomance metrics data among other thing and will (see picture below):

Then the metrics is calculated using preparePopsScriptRequestData, see the picture below:

The method of sending data is rather unique because it utilize the function called touchPixel as follows:

Here is the data is being sent which is using the query string:

https://hadquellseventeen.com/pixel/purst?dl=0&th=0&sc=0&rs=2989.644999999655&rd=2989.644999999655&fd=1635.9549999997398&bv=20.7.v.1&tmpl=70

If you try to directly access using the above link, it will perform response with zero body data and combining with using image as method to send data, it is a very neat method to send information without the user knowing what is going on.

There are two other places that the data gets send using the touchPixel aka zero image downloading method which is sendSuccessfulExecutionMetrics and sendClickMetrics.

As you can see from method names above, these data being sent is important for tracking the user behavior and advertising campaign.

Then there is a call to _0x3d4b60:

Which try to access https://ie8eamus.com/sfp.js but apparently not succeeded due to net::ERR_SSL_PROTOCOL_ERROR

Then it tries to access https://r.remarketingpixel.com/stats using anonymous function:

The call result if successful will by placed in the cookie, but unfortunately it failed with net::ERR_ABORTED.

Then it tries to access https://d24ak3f2b.top/advertisers.js via checkScript function:

This is also not successful because of net::ERR_SSL_PROTOCOL_ERROR. So this script’s activity is not categorized as malware, but is a PUP because it is accessing data that is potentially unwanted and increase internet access bandwidth.

But it is still have some small uncertainty, because of those two scripts above that is failed being accessed.

A JavaScript DeObfuscation Utility

September 15, 2020

By the time I try to analyze the next obfuscated javascript file, I realized that, aside from sanitation and normalizing process, one of the tedious and error prone step is to do manual replace the encoded string access in the script.

This step is done by combining the debugger and editing process by perform debugger break point in arbitrary location and then consult the return value of string access function.

In a typical script, this string access function is in many places reaching thousands of occurrences. For example, the script I’ve retrieved from https://urt7bpvfz4am.com/b8/a6/da/b8a6da6e916d9861c7bedad387d28316.js is about one thousand.

This kind of script contain the initialization of string array, perform rotation and declare the string access function to be used in obfuscated code. Example of this is in picture below:

The top red box is the array of string declaration, followed by array rotation routine and the string access function is declared using _0xfec0 as its function name. For the string replacement in the script execution routine, this function is used in many places, for example like so in picture below:

As you can see, this function is all over the place, several of which I already marked with red box. To perform manual replacement, the script is put into debugger pause, and the function is called one by one in the debugger watch window and the result string is used to replace the source.

It will be convenient if this process can be automated so I’ve created a small console application called EPJsDeOb to do the above task. In order to process the script, the obfuscated script is separated into two file, which I will call header.js and detail.js.

This utility is written in C# and use the ClearScript library that utilize the V8 JavaScript engine for script execution.

The header.js consist of script file that contain the array variable declaration, array rotation and string access function. In the utility, this script will be compiled in the V8 JavaScript engine and used for function execution.

The subsequence part of the script is the script for function call replacement, so for example, when it found the call to _0xfec0(‘0x1’) be replaced with “true” etc. It is using regular expression for the searching.

So, for each matches, the matched function call will be put into the engine and the result string is used to replace the function call.

Here is the utility when called without command line parameter:

This utility requires 3 input, the first is the replacement function name, in the above example it is _0xfec0, this can be obtained from the start of the obfuscated script. The second and third parameter is the header and detail file already described above.

The result will be put into the detail file name with the “-result” string is appended, so for detail.js, it will be detail-result.js.

When called with the correct parameter, the utility will run as follow:

So below is script that is still not processed:

As compared to processed:

This will improve readibility and help reduce time required for analysis.

Source Repository:
https://github.com/surya-rakanta/EPJsDeOb.git

JavaScript DeObfuscation Session

September 14, 2020

The script to be analyzed is obtained from https://urt7bpvfz4am.com/6e660291d14c9b8ecfa04b75332db2e9/invoke.js

The unformatted script is processed using the beautifier.io but there’s a small issue from that website, in that it only beautify the function list and do not perform deobfuscation of variable.

So, let’s use https://webformatter.com/javascript for variable deobfuscation and let’s begin.

Let’s examine the first part of the code:


(function(_0x999765, _0x13ccd6) {
var _0x2cb0a2 = function(_0x470ca4) {
while (--_0x470ca4) {
_0x999765['push'](_0x999765['shift']());
}
};
_0x2cb0a2(++_0x13ccd6);
}(_0xd4b4, 0x1b9));

Using http://www.jsnice.org/ it can be transformed into:


(function(data, i) {
/**
* @param {number} isLE
* @return {undefined}
*/
var write = function(isLE) {
for (; --isLE;) {
data["push"](data["shift"]());
}
};
write(++i);
})(_0xd4b4, 441);

Let’s put the above code in browser debugger and see how it executes. The browser complaint that variable _0xd4b4 is not defined, so let’s give it. It actually a very long array list of strings.

The shift array function will remove the first element and return the value, and the push will put the value to the last element array, in effect it perform the rotation of array element.

In this case, performing static code analysis will bring up confusion. In this case, by using the debugger to process the array and then copy back to the source and disable or remove the above code will make it possible to continue analysis. Another approach is to leave it as it is and continue the analysis using the debugger.

The second part as follows:


var _0x34a8 = function(_0x5a1504, _0x3f6b2d) {
_0x5a1504 = _0x5a1504 - 0x0;
var _0x1f5c99 = _0xd4b4[_0x5a1504];
return _0x1f5c99;
};

Again using jsnice, I have:


var _0x34a8 = function(level, ai_test) {
/** @type {number} */
level = level - 0;
var rowsOfColumns = _0xd4b4[level];
return rowsOfColumns;
};

This is just the function to retrieve the string data from the rotated array list. Notice the level – 0 statement here that it will become clear when it used in the function call as follow:


var sTest =_0x34a8('0x0');
debugger;

The parameter is composed of string of hex values and it will get the first element with is “20.36.5299”, so here the string value will be automatically converted to hex value by virtue of level – 0 statement.

As you can see from the code below, the variable _0x54d9a3 is the logging flag:


_0x403d2f = {
'log': function() {
if (_0x54d9a3) {
var _0x45a439 = _0x522d7d() - _0x23e905;
console['log'][_0x34a8('0x2')](console, ['[' + _0x45a439 + _0x34a8('0x3')][_0x34a8('0x4')]([]['slice']['call'](arguments)));
}
}
},

After that, there’s a conditional checks like so:


if (function() {
var _0x4ade5d = "_0x196a1559e34586fdb";
window[_0x4ade5d] = window[_0x4ade5d] || [];
var _0x369e25 = -0x1 !== window[_0x4ade5d]["indexOf"](_0x4f6701["placementKey"]),
_0x581c37 = window[_0x4ade5d]["length"] >= 0x3,
_0x1f1aa4, _0x1de3f7;
return _0x369e25 || _0x581c37 ? (_0x5c3a9b("/pixel/" + (_0x369e25 ? "nvwbdp" : "nvwbm") + "?key=" + _0x4f6701["placementKey"]), !0x1) : (window[_0x4ade5d]["push"](_0x4f6701["placementKey"]), !0x0);
}())

Which is by using website above translated to:


(function() {
/** @type {string} */
var key = "_0x196a1559e34586fdb";
window[key] = window[key] || [];
/** @type {boolean} */
var inputWin = -1 !== window[key]["indexOf"](_0x4f6701["placementKey"]);
/** @type {boolean} */
var winRef = window[key]["length"] >= 3;
var _0x1f1aa4;
var _0x1de3f7;
return inputWin || winRef ? (_0x5c3a9b("/pixel/" + (inputWin ? "nvwbdp" : "nvwbm") + "?key=" + _0x4f6701["placementKey"]), false) : (window[key]["push"](_0x4f6701["placementKey"]), true);
})();

So, this is basically perform some key checking and added the placementKey to the global variable array. Then after some variable assignment, it then call the core function called _0x572027 which is:


function _0x572027() {
var _0x4b435e = document[_0x34a8('0x9f')],
_0x14a194 = 'dom3ic8zudi28v8lr6fgphwffqoz0j6c',
_0x14d782 = _0x4b435e[_0x34a8('0x16')](_0x14a194 + '=');
if (0x0 === _0x14d782 || _0x14d782 > 0x0 && (';' === _0x4b435e[_0x34a8('0x57')](_0x14d782 - 0x1) || ' ' === _0x4b435e['charAt'](_0x14d782 - 0x1))) {
var _0x5f067b = _0x4b435e['indexOf'](';', _0x14d782);
_0x5d2ca6 = _0x4b435e['substring'](_0x14d782 + 0x21, -0x1 === _0x5f067b ? void 0x0 : _0x5f067b);
} else {
var _0x15b280 = new XMLHttpRequest(),
_0x336262;
_0x34a8('0x5b') in _0x15b280 && (_0x15b280[_0x34a8('0x5b')] = !0x0), _0x15b280[_0x34a8('0x5f')](_0x34a8('0xa0'), 'https://r.remarketingpixel.com/stats'), _0x15b280[_0x34a8('0x60')] = function() {
clearTimeout(_0x336262), _0x5d2ca6 = encodeURIComponent(_0x15b280['responseText']['trim']()), _0x17f872(_0x14a194, _0x5d2ca6, 0x7 * 0x15180);
}, _0x15b280[_0x34a8('0x62')] = _0x15b280[_0x34a8('0xa1')] = function() {
_0x403d2f[_0x34a8('0x34')]('UUID request timed out or failed');
}, _0x15b280[_0x34a8('0x63')](), _0x336262 = setTimeout(function() {
_0x15b280[_0x34a8('0x64')]();
}, 0x3e8);
}
}

Which the string accessing function _0x34a8 is replaced with proper string value using debugger view and then posted to the website above to be more readable:


function _0x572027() {
var axis = document["cookie"];
/** @type {string} */
var artistTrack = "dom3ic8zudi28v8lr6fgphwffqoz0j6c";
var val = axis["indexOf"](artistTrack + "=");
if (0 === val || val > 0 && (";" === axis["charAt"](val - 1) || " " === axis["charAt"](val - 1))) {
var object = axis["indexOf"](";", val);
_0x5d2ca6 = axis["substring"](val + 33, -1 === object ? void 0 : object);
} else {
/** @type {!XMLHttpRequest} */
var xhr = new XMLHttpRequest;
var _takingTooLongTimeout;
if ("withCredentials" in xhr) {
/** @type {boolean} */
xhr["withCredentials"] = true;
}
xhr["open"]("GET", "https://r.remarketingpixel.com/stats");
/**
* @return {undefined}
*/
xhr["onload"] = function() {
clearTimeout(_takingTooLongTimeout);
/** @type {string} */
_0x5d2ca6 = encodeURIComponent(xhr["responseText"]["trim"]());
_0x17f872(artistTrack, _0x5d2ca6, 7 * 86400);
};
/** @type {function(): undefined} */
xhr["onabort"] = xhr["onerror"] = function() {
_0x403d2f["log"]("UUID request timed out or failed");
};
xhr["send"]();
/** @type {number} */
_takingTooLongTimeout = setTimeout(function() {
xhr["abort"]();
}, 1E3);
}
}

Which is basically perform posting some data to remarketingpixel.com website. Now let’s see the log result and what kind of data that it tries to post.

Below is the console log:

By examining the above function apparently there are no data that get posted to r.remarketingpixel.com. This site is part of google adsense marketing campaign. This concludes the JavaScript deobfuscation session.

Analyzing Volatility’s imageinfo Plugin Issue

September 10, 2020

When I try to use the *.vmem from Windows 10 Version 1909 (OS Build 18363.1016) in volatility, after a lengthy process it eventually given up:

Let’s perform detailed examination of the plugin which is located in \volatility\plugins\imageinfo.py. First, it tries to build a profilelist object:

As seen from the above, this is from registry.get_plugin_classes which is located in \volatility\registry.py:

Then, from _get_subclasses, it will perform recursive process which may cause of lengthy process to get all the great grand child using yield function:

By using the debug.info(“Sub Class of ” + cls.__name__ + ” -> ” + plugin.__name__) inside the get_plugin_classes above, I can list out all possible profiles for Windows 10 as follows:

Win10x64_17134, Win10x64_15063,Win10x64,Win10x64_10240_17770,Win10x64_16299,Win10x64_10586

When I try some of the above profile for example Win10x64_16299, I get this result below:

So, let’s check how the imageinfo plugin perform detection of profile to be used from the memory image. Here is the call stack that leads to the profile class initialization:

And here is the actual class initialization:

So the volatility framework will perform gathering of all available profiles and instantiate the profile class to be processed. For example, the first member of the profile list in profs dictionary object is Win2008SP1x86:

The dot notation denotes the file path that leads to the class being instantiated and from the above example, the source of Win2008SP1x86 is in \volatility\plugins\overlays\windows\vista.py. The class itself can be search using find inside vista.py:

So, what happened after the volatility retrieve the class profile ? It will try to scan for presence of specific KDBG header in the image. Except for special conditions, The KDBG header signature is initialized at AbstractKDBGMod class in \volatility\plugins\overlays\windows\windows.py:

Depending on the architecture, when it is 32 bit, it will be prefixed with series of zero and when it is 64 bit, it will be prefixed with series of bytes as the above picture. It has the method called modification that will be called whenever there is a sub class that use this class as the parent. Picture below is one of the call stack when the modification method is called:

The modification call is part of the process of adding the modules that is the sub class of ProfileModification to the current profile.

For example, in \volatility\volatility\plugins\overlays\windows\vista.py there are 2 kinds of signature, which is VistaKDBG and VistaSP1KDBG. Both is a sub class of AbstractKDBGMod which in turn is sub class of ProfileModification. These two will be added to the profile. But how the framework find the related KDBG signature for Win2008SP1x86 ?

It is assigned in members property and here is the call stack leading to members assignment:

The members assignment itself is as follows in \volatility\obj.py:

This members property is retrieved from the vm object. Here is the object path to members property:

As you can see, it has the type of VOLATILITY_MAGIC and for this version of volatility, it has 23 dictionary objects, one of which is KDBGHeader:

The vm object itself is passed as a parameter from buf object which is obtained from calling the BufferAddressSpace class instantiation of BaseAddressSpace object in \volatility\plugins\kdbgscan.py:

Since the KDBGHeader is part of the profile object as shown above, it is assigned using private method _set_profile:

The config.PROFILE is a string of profile name to be instantiate as a class, for example Win2008SP1x86. Inside _set_profile, the profile is instantiated using this command:

Also KDBGHeader is part of the types dictionary object which in turn is part of VOLATILITY_MAGIC object, it is assigned during the compile process as follows:

This method resides in \volatility\obj.py and the types is assigned from vtypes, which contain, among others the VOLATILITY_MAGIC object:

The vtypes itself is initialized using a call to self.load_vtypes() but the VOLATILITY_MAGIC itself which contains KDBGHeader object is initialized during self.load_modifications(). For KDBGHeader initialization, it is eventually assigned at profile.merge_overlay. Recall that in previous paragraph I already explained of how KDBGHeader is initialized. The reason that Win2008SP1x86 can get the appropriate KDBGHeader signature is that modification method is called twice, one for VistaKDBG and then it is called again for VistaSP1KDBG.

The above 2 calls is the result of check method:

The condition is is the OS version identification. If condition is true, it will proceed with modification call. The picture below is the condition for VistaKDBG and VistaSP1KDBG (defined in
\volatility\plugins\overlays\windows\vista.py):

As you can see, both has the same major and minor version, so the modification will called twice since both condition checks is true, but since VistaKDBG is defined before VistaSP1KDBG, it will processed after VistaKDBG.

Now, back to the cause of why the volatility framework can not detect my Windows 10 memory image, let’s perform break point for a sample windows 10 which is Win10x64_17134 and see what kind of KDBHeader signature it tries to find. To see the KDBGHeader signature being check, I can perform breakpoint at calculate method in \volatility\plugins\kdbgscan.py and I have as follows:

Based on the above hexadecimal bytes, it can be seen that kdbgsize is 0x0368 (the small character ‘h’ is 0x68) and this size is defined in Win10KDBG (\volatility\plugins\overlays\windows\win10.py) and only one instance of this signature checking. So no matter what profile string of windows 10 profiles, it always perform checks using this signature.

And for my memory image, it even do not have the 64 bit type of KDBG prefix and this cause the volatility’s imageinfo failed to detect the OS type memory image after a lengthy process. One practical method to determine whether your Windows 10 x64 memory image can be processed by volatility is to check the presence of KDBG bytes sequence above.

As for the question of how to detect my version of Windows 10 x64 image, it is related to the basic design of the volatility and more works of reverse engineering in this version of windows is required. Once it is done, the information gathered can be used to enhance or modify the volatility, but in this case I think I’ll stop for now 🙂

Analyzing IAT Hook Detection in hollows_hunter

September 3, 2020

Performed the key logger setup as described in previous article, but instead of just running the hollows_hunter in command prompt, let’s perform detailed examination in the debugger.

Here is the call leading to the IAT hooks count in hollows_hunter:

It is in \hollows_hunter\pe-sieve\scanners\scan_report.cpp. It will eventually leads to a call to countResultsPerType(type, SCAN_SUSPICIOUS). Inside this function, there is a class called reportsByType and each type has module set and each has a status in it. As you can see from the picture below, it is of type ModuleScanReport.

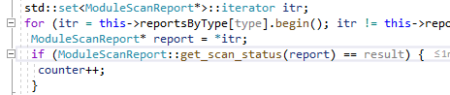
So, if the status is SCAN_SUSPICIOUS, meaning that the module is marked as suspicious, it will increase the counter.

In my case of testing program (see previous article), the module marked as suspicious is C:\Windows\System32\imm32.dll

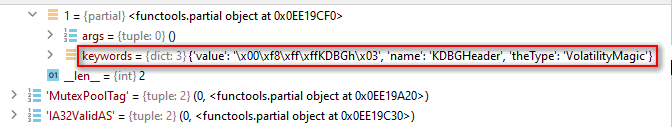
From the above picture, The reportsByType object is of type pesieve::IATScanReport. Let’s checked the mechanism of how it mark the status as suspicious.

The suspicious status for the IAT hook is coming from pesieve::IATScanner::scanRemote inside \hollows_hunter\pe-sieve\scanners\iat_scanner.cpp.

It is based on the having the not_covered class of type ImpsNotCovered count is greater than zero:

But first I have to understand how the remoteModData object is initialized, because it is this object that is being analyzed for presence of IAT hook. This object is initialized in \hollows_hunter\pe-sieve\scanners\scanner.cpp as follow:

The processHandle is the process handle of the process being examined, in this case is the test program that contains windows key logger hook.

The hMods is an array of imported modules and the counter depends on the value of modules_count which is initialized at:

As you can see, the above variable (modules_count) is depended upon enum_modules (\hollows_hunter\pe-sieve\utils\modules_enum.cpp) which is using the EnumProcessModulesEx Windows API:

The first module in the module list is the main process itself and it is stored in modData object as well as other modules., but I notice there’s a discrepancy in the size (original_size) field when it is compared to the actual file size. For example the main process file size is actually 1510912 bytes but it is recorded as 2097152 bytes:

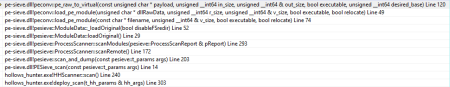
The value of 2097152 is calculated from payload_nt_hdr->OptionalHeader.SizeOfImage:

The source is in \hollows_hunter\pe-sieve\libpeconv\libpeconv\src\pe_raw_to_virtual.cpp with the call stack that as follows:

Now back to when the remoteModData is used for analysis at \hollows_hunter\pe-sieve\scanners\iat_scanner.cpp:

So here, there are no information about which module name being analyzed, only the imgBufferSize that is being propagated from the SizeOfImage data item. This will cause confusion as to which module is actually being analyzed. It is after some further steps in digging that I realized there’s some connection between modData and remoteModData.

In this case, when performing the debugging step through the above location, besides the remoteModData, you can view the corresponding modData for more information about the module name.

But it should be noted that remoteModData is the in memory module, where as modData is the module that is retrieved from disk.

Now back to the mechanism to check for IAT hook, as you can see, it is based from presence of not_covered count. This value is modified at the call to peconv::fix_imports(vBuf, vBufSize, exportsMap, &not_covered).

The above function is defined in \hollows_hunter\pe-sieve\libpeconv\libpeconv\src\fix_imports.cpp

You notice that in fix_imports method, it is consuming the exportsMap object. Let’s find out how the exportsMap is initialized by examining the call stack that leads to the fix_imports call:

The exportsMap is passed as a parameter during the scanRemote, but checking into this routine, the initialization process is not found, so other means to finding this object should be devised, and it is located in the IATScanner class object constructor:

Here is the exportsMap parameter that’s get passed to the IATScanner:

It is in \hollows_hunter\pe-sieve\scanners\scanner.cpp and passed from the process_report object that is a parameter for scanForIATHooks method. the process_report is of ProcessScanReport class and it is initialized when the given module list has the export function in add_to_lookup method:

The modData.original_module parameter is the raw image data. This is inside add_to_lookup method as follows, it is defined in \hollows_hunter\pe-sieve\libpeconv\libpeconv\src\exports_mapper.cpp:

The currFunc contains the function information such as name and the callRVA is the RVA of the address of the actual function body. The add_function_to_lookup function will add the exportsMap data accordingly. In the end exportsMap will contain usable export function information to be used in the verification process of import function of the process to each corresponding export function list.

The call_via_ptr will be calculated from the import table of the running process using FirstThunk by adding the RVA of each entry to the module base address. This is an example of the address pointer of the call_via_ptr:

The address is the RVA + base address of the modules in the process. As you can see, the content is 0x7732c450, this will be checked to the exportsMap in the method below:

It is declared in \hollows_hunter\pe-sieve\libpeconv\libpeconv\include\peconv\exports_mapper.h. The va itself in exportsMap is calculated by adding the RVA of export table to the moduleBase which is actually the module handle value (HMODULE).

In the above example the import address 0x7732c450 is corresponding to GetWindowTextA of user32 library. When the imported function address it is found in the export list, it will added to the addresses list for further checking, which will be updating the notCovered object variable.

The notCovered is updated in the ImportsUneraser::uneraseDllImports method as follows:

The variable dllCoverage.addrToFunc is the list of imported addresses, which is the addresses from the above. Inside ImportsUneraser::fillImportNames, the notCovered object is updated as follows:

This function resides in \hollows_hunter\pe-sieve\libpeconv\libpeconv\src\imports_uneraser.cpp with the call stack that leads to the above call as follows:

The addr_to_func object is obtained from all export functions in the disk file per module (for example user32.dll) and the searchedAddr is the import address from the memory. So, when the searchedAddr is not found in the addr_to_func object, there is a modification in the process memory for the related import address and the notCovered object is added. When this count is greater than zero, it will added to IAT hook report.

The reason that hollows_hunter reports IAT hook is that when the import addresses list from kernel32.dll in imm32.dll is cross checked to the addr_to_func list, it is not found in the list. But by performing the offline check using actual import address of the DLL file, for example using IDA disassembler, reveals 61 import addresses, whereas the addr_to_func list for kernel32.dll is 60, so missing 1 (one) item that is reported by hollows_hunter.

Let’s perform detailed examined of how addr_to_func is populated in hollows_hunter. The addr_to_func is derived from addrToFunc variable inside dllCoverage object:

As you can see from the above picture, it results in 60 items, missing one item. The addrToFunc itself is updated inside the call to map_addresses_to_functions. Here is the call stack to this function at the time when the module is imm32.dll and the imported dll from imm32.dll is kernel32.dll:

And here is the cause of the missing one item in the addrToFunc list:

The given address is 1963722320 (0x750C0650). This import address from kernel32.dll is then cross checked to exportsMap object using find_exports_by_va. The found object is then cross checked to the library name, and it is compared to the chosenDll. From the above case, the chosenDll is “kernel32” but when it is cross checked to the all exports object, the corresponding address is belong to “kernelbase”.

hollows_hunter application will make a report as follows:

1b048;kernel32.GetProcessMitigationPolicy #696->kernelbase.GetProcessMitigationPolicy #692;74fb0000+110650;0

The address 74fb0000+110650 when calculated points to kernelbase.GetProcessMitigationPolicy (0x750C0650), whereas the value 0x1b048 is from the notCovered.thunkToAddr or the RVA (address location) of import entry. In this case, the RVA is starting at 0x1B000 and 0x1B048 is the location which contain 0x750C0650 that hollows_hunter marked as IAT hook, because it has different DLL name when compared with the export list.

The left hand side of imported function name of kernel32.GetProcessMitigationPolicy is retrieved from the exportsMap list.

Actually there’s a same export function name for GetProcessMitigationPolicy for both in kernel32.dll and kernelbase.dll and for some reason, the windows itself perform the IAT patch for this function to use the one inside kernelbase.dll instead of kernel32.dll.

How to Diagnose and Fix Kendo DatePicker Issue

August 19, 2020

I add the format string to the grid column with the date data type as follow:

But when I try to add a new row with the column that has the date data type, I get the weird output as follow:

Let’s perform detail examination of how the above weird input is generated. First check in addRow function (kendo.grid.js):

After the data insertion process, the grid will trigger the CHANGE event:

With callstack as follow:

The change event handler is Initialized with kendo binding mechanism (kendo.core.js) at:

So, here is the call stack when the CHANGE event is triggered in the kendo grid:

The output is the result of:

Inside the _renderContent:

The passed templates parameter to _rowsHtml as follows:

It uses the anonymous function with the content as follow:

The call stack to kendo.format:

The function detail at kendo.format (kendo.core.js):

So, when I specify the format property in the columns object above, it will create the template by calling the kendo.format function, so the solution is to create a template:

Now when I add a new row for disabled date field, it will show the current date, but it should be blank:

It is in the defaults value when the kendo framework generates model (kendo.data.js):

The call stack leading to above routine:

The defaults object initialization (kendo.data.js):

So, the solution is to add defaultValue property on grid initialization for the date column:

But it will return a “null” string instead of blank:

So, perform revision to the toString function (kendo.core.js) as follow:

This will cause the column value will be blank when the value contains a null.